
OnMyBubble
Author: AliCatCapital , Last Modified, 2022-03-09 Category: finance Keywords: MEASURING-ALPHA-a-Hedge-Fund-Model-Oscillators
1809 views 45
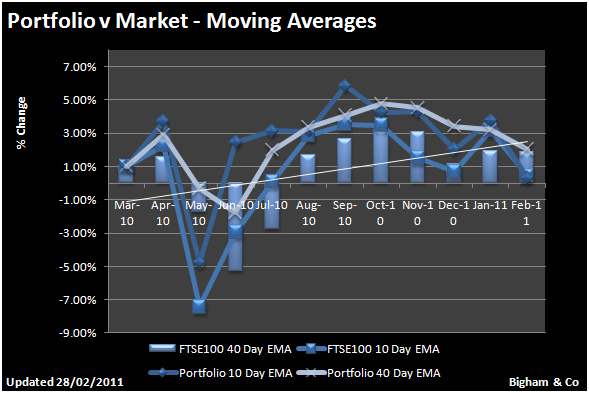
How to measure Alpha when allocating capital to a basket of stocks in a position based trading portfolio.
The use of market oscillation is an effective way to time entering and exiting your positions.The chart above helps us to measure the position of our portfolio relative to the broader market.
In my trading I use this only as a guide, but on an individual stock level, I used the relative position to make trade execution decisions.
This is an incredibly effective way to be disciplined. It is a rule based approach that cannot be overridden by human judgement. The use of these oscillators is therefore a signalling mechanism. Signals in the hedge fund managers models can be based on charts or underlying math built into a Boolean string function, Essentially the market at any point in time can literally be read in English, pre programmed based on the numbers, the chart simply acts a a useful data visualisation of the math.
Of course to rely on the chart and not have an understanding of the intrinsic math is dangerous. The hedge fund managers experience and overall appreciation of the Macro Economic environment is as important as the short term market signal.
This is not about reading charts to understand the market. This is about constructing charts to visualise your math
This approach presupposes that the hedge fund manager has analysed the numbers and determined the rule he or she believes is driving the share price movement, then building a model with charts to better visualise the math.It is quantitative modelling as apposed to Chartism or Technical Analysis. But there are merits and risks in both of course, but it worth mentioning the distinction.


Keywords:MEASURING-ALPHA-a-Hedge-Fund-Model-Oscillators
Blog title: MEASURING ALPHA a Hedge Fund Model Oscillators( 29 articles!)
Trading with OMBCoin a digital currency for the new millenium
Understanding Big debt Crisis By Ray Dalio
My Top Ten Tips For Budding Online traders Million Dollar Trading
 DISCOVER HOW I BEAT THE MARKET CONSISTENTLY
 Is it easy to trade stocks online for a living
 Trade Back Testing
  Theresa May Strikes Deal on EU Withdrawal Agreement
 European Medicine Agency
 Excel Trading System Development
 Excel Trading System
  Trading System Risk Analytics
 How do online traders manage risk?
 What is the Investment Outlook for 2018?
 MEASURING ALPHA a Hedge Fund use of Oscillators
 Excel Trading System
  Deal Statement Template
 Excel Trading System
  MEASURING ALPHA a Hedge Fund Frequency Distribution of Returns
 online trading in 2017
 What is the Investment Outlook for 2020?
 MEASURING ALPHA a Hedge Fund Model Prices
 About AliCat Capital Management
 MEASURING ALPHA a Hedge Fund Model
 Performance Brief for AliCat Capital
 Generating 44% ROE from £ 50M
 How To Get Rich The Felix Dennis Way
 online trading in 2017
 online trading systems
 music (58)
 fashion (16)
 car (10)
 real_estate (27)
 beauty (9)
 travel (22)
 design (31)
 food (44)
 dating (8)
 movie (13)
 photography (5)
 law (6)
 health (17)
 green (4)
 technology (16)
 SEO (5)
 marketing (11)
 history (10)
 lifestyle (17)
 university (3)
 dog (1)
 money (10)
 business (59)
 fitness (12)
 wedding (8)
 education (3)
 science (1)
 shopping (7)
 entertainment (11)
 sports (17)
 cat (6)
 social_media (1)
 medical (3)
 wine (4)
 celebrity_gossip (4)
 DIY (5)
 nature (2)
 gaming (65)
 pet (6)
 finance (35)
 political (4)
 career (8)
 parenting (4)
 economics (17)
advertisement


MEASURING-ALPHA-a-Hedge-Fund-Model-Oscillators OnMyBubble.com